Showing posts with label fun with statistics. Show all posts

Tuesday, 8 May 2012

The Boris Effect pt II - with another graph.


While I wait for the ward level data, here's a bit more on the Mayoral first preference votes.  This graph shows the advance or decrease in the votes for Boris or Livingstone from 2008:


I have not been able to come up with a prettier looking positive / negative chart, but I think this tells the tale fairly clearly.

First up, note the huge upswing for Livingstone in the London borough of - wait for it, wait for it - Tower Hamlets (and, technically) City and Newham.  Quelle surprise.  While TH's equivalence to Richard Daley's Chicago for non-traditional democracy is well known, one can also factor in the absence of a Trot mayoral candidate this time.   Bar North East, Livingstone did not put as much as 5000 votes anywhere else.  What, one wonders did he do to so alienate Merton & Wandsworth?  Threaten to cancel Wimbledon and turn Clapham Common into a radioactive tip?  He dropped just shy of 10,000 votes from 2008.

Boris gained a small uplift in Barnet & Camden, where Livingstone fell back.  I think that certain hateful comments about Jewish Londoners did KL no favours.  Boris got his biggest upswing in my own haunt of South West.  Set against that, note the heavy falls in the Boris vote in Bexley & Bromley and Havering & Redbridge.  I'm putting this down to the bone-idleness of Tories in the eastern outer 'burbs rather than anything else.    

Saturday, 5 May 2012

The Boris Effect - with gratuitous graphs

Until such time as the London Elects bods get around to providing ward level data and I can go to town on that, I have been fiddling around with 2008 and 2012 data to see how Boris (hurrah for his re-election, btw) fared on first choice votes relative to his ideological confrères in blue.

Chart one shows the percentage of Boris's vote achieved by each Conservative assembly candidate in 2008 and 2012 and in each case the candidate fared worse than Boris in 2012 than in 2008, or if you prefer, Boris outdid the candidate each time.  So, taking a wholly random example, South West's Tony Arbour polled 76,913 votes to Boris's 90,061 in 2008 - or 85.4% of Boris's total.  In 2012 the figures were 69,151 to 92,180 and 75%.  This gives a Boris Factor or BF of 10.4.

The lowest BF is in Bexley & Bromley, at 1.8.  B&B is a pretty solid seat, so that comes as no great surprise, and it could be argued that folk were more inclined to vote for the slate than elsewhere.  Lambeth & Southwark had a BF of 4.9, suggesting that those poor, benighted souls were sticking with the local Streatham lad made bad.

At the other end of scale, Barnet & Camden had an epic BF of 24.5, and Brent & Harrow's was 21.6.

More later, maybe.                  

Monday, 23 April 2012

The Front National's vote share - it's a bit more complicated....

Judging from news websites and the Today programme, the second lead story on the French presidential election is that Marine Le Pen's Front National scored its 'highest ever share of the vote', at 17.9%.  And in strict terms that it is true, if somewhat misleading.

A little digging in the 2002 results shows that there was a split in the FN vote between the old poujadiste's original FN, and the Mouvement National Républicain, which split from the FN in 1999.  Le Pen polled 16.86% in 2002, while the MRN polled a further 2.34%, for a combined 19.2%.  While the MRN is / was a tad more respectable (so to speak) than the FN, there cannot be any serious argument but that the two parties were fishing in the same pool.

More fun with French stats later, probably.

Wednesday, 18 April 2012

Your cut out 'n' keep to London's least talented electorates

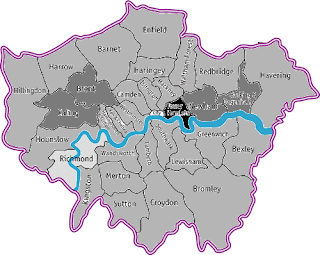
Those nice people at London Elects have been kind enough to make ward level data from the 2008 Mayoral / LA elections available, and turnout and vote share maps having been done elsewhere I've had a go at doing spoilt ballots, council by council.

  
Black (hello and welcome, Tower Hamlets) represents 3.2% of all first choice ballots being ineligible through mismarking, no mark etc.  Dark grey (Ealing, Brent, Newham and Barking and Dagenham) represents 2.1-3.1% ineligibility and light grey 1.1-2.0%.  Very light grey - Richmond - managed a 99% success rate and the City of London 99.6%.

Ward level data shows that the very worst figure is a 7.08% vote failure in Alperton, a ward in Brent.  if Wikipedia is to be believed, Alperton is 75% ethnic Indian and 10% ethnic Sinhalese/Tamil, so it would seem that language might be a problem.  Also at or around 1 in 20 are are Southall Green (Ealing, 5.9%), Spitalfields & Banglatown (Tower Hamlets, 5.5%), St Dunstan`s & Stepney Green (Tower Hamlets, 5.1%) Whitechapel (Tower Hamlets, 4.9%), Norwood Green (Ealing, 4.9%), Larkhall (Lambeth, 4.9%) and Kenton East (Harrow, 4.8%).

At the other end of the scale, two out of 1,312 City of London postal voters made a hash of it (0.15%), while the most talented polling station visitors were to be found in Kensington & Chelsea's Royal Hospital ward where 99.43% got it right.  Nice that the Chelsea Pensioners are keeping good company, and doubtless providing it themselves.        

Digging a little bit deeper, Alperton leads for blank ballots - 4.4% and while all of the electors of Bromley -Biggin Hill found something to mark.  Identifying oneself on the ballot paper seems to be a Lambeth vice, at 2.8% in Larkhall and 1.4% in Oval.  Over voting was big in Plaistow South (Newham) - 3.3%, Southall Green (Ealing) - 3.2% and Tottenham Hale (Haringey) - 3.1%

Friday, 9 March 2012

British and French in 'not arrogant' shocker

I am indebted to the lovely people at Pew Global for making their survey on 'the American-Western European Values Gap' available online, so I've picked the best bits and knocked up another couple of charts.

Asked this question - Our people are not perfect, but our culture is superior to others” - the polling results look like this:


Interesting, no?  The supposedly self-satisfied / exceptionalist French are the least confident / arrogant across all age ranges, while the supposedly cringing / perpetually apologetic Germans have the smuggest youngsters (well, under 30s).  Our American chums lead in self-belief in the two other age breaks.  Meanwhile, what is going on with Britons born between 1962 and 1981?  Most of that cohort would have known Thatcher, Major or Blair as the first prime minister of their adulthood, two of whom were not exactly shrinking violets.  

The breakdown by gender is not as dramatic, but is of interest nevertheless:


Taking a wild stab in the dark, I would imagine that women lead in most countries as there are more of them among the older.

Shame that Pew did not poll the Chinese....


Thursday, 8 March 2012

And the Liberals will inherit the earth, or at least a lot of EU Commissions

For reasons too dull to divulge, I have been mulling on the EU's Commissars and noted that there are rather a lot of Liberals among them.  Commissioners take a vow of political celibacy -

"Having been appointed as a Member of the European Commission by the European Council, following the vote of consent by the European Parliament I solemnly undertake: to respect the Treaties and the Charter of Fundamental Rights of the European Union in the fulfilment of all my duties; to be completely independent in carrying out my responsibilities, in the general interest of the Union; in the performance of my tasks, neither to seek nor to take instructions from any Government or from any other institution, body, office or entity; to refrain from any action incompatible with my duties or the performance of my tasks.
I formally note the undertaking of each Member State to respect this principle and not to seek to influence Members of the Commission in the performance of their tasks. I further undertake to respect, both during and after my term of office, the obligation arising therefrom, and in particular the duty to behave with integrity and discretion as regards the acceptance, after I have ceased to hold office, of certain appointments or benefits". 

To which I would retort, go tell it to the marines....

Anyway, back at the plot, the current 27 break down thus - nine ALDE (Liberals to you and me) aligned at nomination, Six PES (Socialists), nine EPP (Christian Democrats) and three apparently unaffiliated.

A pie-chart of which looks like this:


That's a lot of Liberals, isn't it?

What would a Commission based on populations currently ruled by each party look like? 

Like this:


The PEL (blow-dried Bolsheviks) rule Cyprus, but the good people of Cyprus fail to reach 1/27th of  the population of the EU by, oh, about 17.8 million so no sinecure for the PEL.

The AECR is the Euro grouping cobbled together by our own dear PM, and those four Commissariats represent the population of these parts plus the Czech Republic.

The PES would get one seat - losing five - based on the populations of Austria, Denmark and Belgium all of which are currently groaning under the red wheel.

The ALDE slides from nine to two, courtesy of Romania, the Netherlands and Estonia.

The technocrat governments of Greece and Italy are taken to be neutral.

And the big, big winner is the European People's Party, which jumps from nine to 16, aided by France, Spain and Germany.

Thursday, 12 January 2012

In a pique on Darien

(Joke stolen from Flann O'Brien)

Imagine, if you will, that an indigent friend comes to you asking for just under £400,000 having gone bankrupt.  Being a generous soul, you agree to the sum, but as a condition the friend agrees to enter into business with you.  Some way down the line, the friend decides to exit the business.  Might you, perhaps, want your money back, compounded?

This is roughly what has happened with our Caledonian neighbours, who we bailed out in 1707 with the Act of Union, their having blown rather a lot of money on their attempt to build an empire in what is now Panama in the quite extraordinarily ill-fated Darien Scheme - see here, here or the inevitable Wikipedia link.

Anyway,  £398,085 (and the all important 10 shillings) in 1707 terms would be worth rather more now, and the rather nifty calculator at measuringworth suggests £52m based on RPI or £725m based on average earnings.

I look forward to Alec Salmond including this sum in his next budget.

Thursday, 10 November 2011

Would you dig down the back of your sofa for £3.86 bn?

Tough call isn't it?

This, from the EUPravda, more specifically the European Court of auditors:


"The ECA concludes that the 2010 accounts present fairly the financial position of the European Union and the results of its operations and its cash flows for the year. However, the payments underlying these accounts were still affected by material error, with an estimated error rate of 3.7 % for the €122.2 billion of EU spending. The error rate is not an estimate of fraud but reflects the ECA’s estimation of the degree of non-compliance with the rules governing the spending, such as breaches of public procurement rules, ineligible or incorrect calculation of costs claimed to EU co-financed projects, or over-declaration of land by farmers. The control systems tested across the EU budget were still only partially effective in ensuring the regularity of payments". 

I make 3.7% of €122.2 €4.52 bn, or £3.86bn. Or not a million miles away from what we have budgeted for the prison service next year - £4.6 bn.  And more than we will be spending on foreign military aid, a surprisingly high £3.6 bn.

Monday, 25 July 2011

Qualified to vote?

I imagine a number of folk have read about the UCU's analysis of qualifications by constituency, and because I thought it would be amusing I've been playing around with the London stats and engaged in a little light graphing.  Bottom of the heap for lack of qulifications is the demi paradise that is Ilford South at 20% (UK Polling report profile here) .  At the other extreme is Brent North (better described as Wembley, I reckon) at a fairly creditable 1.9%.  This is how BN is described at UK polling Report:  "High ethnic population in UK constituencies is normally associated with deprived inner city seats, but Brent North is most owner-occupied residential suburbs. This is a seat of upwardly mobile successful Asians".

Anyway, chart 1:


(Ilford South - Ealing North)
 (Hammersmith - Ruislip)


(Old Bexley - Brent North)

There are 73 London seats.  This is the division, by party, of the 37 least qualified electorates:
And the rest:


I wonder what manner of conclusion on might draw from all this.....

Tuesday, 12 April 2011

Bone-idle Belgians and hard-working Mexicans

The OECD has been investigating hours worked (paid and unpaid - so including household matters) by country, and Belgian daily Le Soir is rather pleased to report that Belgians work the least - 427 minutes a day, or about 7 hours and seven minutes a day.  We rack up 7 hours 53 minutes, but given that shopping is counted as work, and knowing how much some of us like that.....


Anyway, a chart of those countries mentioned in the article:


Friday, 8 April 2011

EU enthusiasm in an unexpected place - Gibraltar

EURid (crazy name, crazy guys...) has been kind enough to publish stats for registrations to date of the .eu top level domain by country / territory, and Germany emerges a clear leader based on raw volume - 1,041,614 so far.  Bottom of the heap is French Guiana at 59, although it is possible that there are other special cases where no registrations have been made - St Pierre & Miquelon for example.  We've managed just shy of a third of a million.

Anyway, so far so not very interesting.  I have had a go at charting .eu registrations relative to population, and it is Gibraltar which emerges as by far the most enthusiastic, with 3,370 registrations for a population of 31,000.  This, I would imagine is down to UK entities with a Gib presence preferring .eu to .gi, thinking it less likely to scare the horses.  Of the EU 27, Cyprus leads from Luxembourg and the Netherlands.

(click chart for legible version).

At the other end of the scale, of the sovereign states it is the Spanish, Portuguese and the Romanians who have the lowest level of registrations per capita.  However, it is France's Dom-Toms - the recipients of quite phenomenal levels of EU largesse - that are the least enthused.  Still more hopeless stattos can find figures for net donors and recipients per capita here.

Friday, 11 March 2011

How to say 'hypocrite' in French

I am indebted to France Soir for commissioning a poll of Gallic types on their support or otherwise for UN military intervention in Libya and whether they would want France's military to join in.

Overall support for the first option stands at a not very high 36%, with the Left generally more supportive than the Right - 42% of Socialists to 38% of Gaullists.

Comparing support for UN action with support for French involvement throws up some fairly yawning chasms:

32% of women want 'something done', but only 24% support French involvement.  The gap for the overall Left (Socialists, Greens, Trots etc) is eight percentage points - 39% vs 31%.  The gap for Communists / Left party voters is the broadest - 14 percentage points between the 33% for UN intervention and 19% for French participation. 

The highest level of support for French involvement is the 35% for the Greens - not what I would have expected.  Maybe they are worried about the palm trees.  Credit, I suppose, is due to Frontistes - both options rated 30% support among them.   

Thursday, 3 March 2011

Going backwards - at speed.

Our friends in Brussels have just published the first, ahem, 'Parlemeter' of 2011, which looks at awareness levels and the image of the EU 'Parliament' across the 27.

One of the questions is whether MEPs sit by nationality or political allegiance.  Overall awareness that it is the latter is a less than brilliant 42%.  I will grant that it is not wholly ridiculous to think that MEPs might cluster by nationality, but what is unexpected are the changes in level of awareness over the course of last year:

 
So, 18 countries saw a higher level of incorrect answers than at the start of the year.  I would suggest that +/- 2% represents a fair margin of error, but that still leaves 14 countries with drops of 3%-10%.  So, just what happened in Finland that some 10% of the population saw its awareness going backwards?  Maybe knowledge of the EU 'Parliament' is not the most mission critical item of information in the mind of the average sane person, but I am bewildered by the degree to which knowledge has been lost.  Have evil trolls been spreading disinformation on the streets of Helsinki, perchance?   Mind you, our figure is down 4% on the year too.  At the other end of the scal, something must have stirred up our Portuguese chums as their awareness climbed 12%.  Looking at overall figures, the Dutch are the most up to speed on these things, with 61% knowing it is political allegiance, whereas only 26% of Czechs know that.  Going off at a tangent, it might add to the gaiety of the nation if Westminster MPs sat geographically - Bercow surrounded by Tories, the Ulster MPs sharing bench space, Wirral West's Esther McVey in a sea of red etc etc.

Elsewhere, I am delighted that we Britons are least likely to think that 'democratic' describes the 'parliament' well.  

Tuesday, 1 March 2011

A mini DPRK nugget

As long time observers of North Korea will know, Japan is not one of the DPRK's favourite places, so I offer up this piece of spin:

"False marriage is rampant in Japan, touching off strong public criticism.  The police authorities of Japan announced on Feb. 24 that the number of forged marriages with foreigners, exposed across the country last year, reached to 153 cases, an increase of 14.2 percent over the previous year. 
Rampant, eh?  Assuming that Japanese folk are still marrying at the same rate as they were in 2005 (the most recent figures a quick search has thrown out), that would give a figure of 0.02% for 'green card' marriages.  If it continued to grow at the same rate, it would be 2022 before one in a thousand were fraudulent rather than the current one in 4700.

Wednesday, 23 February 2011

Of patents and the like

I spotted this at KCNA:

"The World Intellectual Property Organization (WIPO) announced in Geneva on February 9 that China's international patent applications increased sharply last year, making the country the world's fourth IP applicant....WIPO noted IP applications are on steady increase in northeast Asian nations".

Now the KCNA's take on anything is always to be taken with a shovelload of salt, or at the very least rates a bit of act checking.  Anyway, while there is nothing incorrect in the statement, it is what the KCNA omits that is of interest: "International patent filings under WIPO's Patent Cooperation Treaty (PCT) increased by 4.8% in 2010, with strong growth from China (+56.2%), the Republic of Korea (+20.5%), and Japan (+7.9%)".  Source 

Ah - so the KCNA wants to suck up to the 'People's Republic' of China (of which there has been a lot more than usual of late) but can't bear to name the other names of 'northeast Asian nations' because that includes two out of the DPRK's three least favourite places, South Korea and Japan.  The US, natch, is the other least favoured nation and leads, as this chart shows:


(Click for improved legibility).

And lo and behold, the US, Japan and South Korea muster 53% of the projected 2010 patents.  We managed 3%.


Because I think it is least mildly interesting, here are those figures based on patents per head:

Wherein the Swiss lead from the Swedes and the Finns.