Monday 28 May 2012

Far too good not to broadcast

This, from a South African news site, and deserving of a narrower audience:


"Gauteng MEC for Local Government and Housing, Humphrey Mmemezi, used his government-issued credit card to buy an artwork worth R10 000 from burger chain McDonald’s. The initial transaction was disguised to indicate the buying of R10 000 worth of burgers. The R10 000 would buy 256 Big Mac burger meals with large chips and a Coke at R38.95 a piece".(MEC is the equivalent of MSP/AM etc).
At the risk of spoiling the story, it would seem that Mr Mmemezi was not acquiring one of those panels showing Ronald McD fighting off Hamburglar, but rather laundering through the joint's business bank account. 


Tuesday 8 May 2012

An antique (1912) Hansard trawl,

It's been a while, hasn't it?

Those wicked Americans:


Mr. KING asked what number of claims arising out of telegraphic cables cut in the West Indies were preferred against the United States Government as a result of the Spanish-American war; how long a period elapsed between the presenting of the claims and their final settlement; and what was the total amount of compensation paid.
§Mr. ACLAND As far as I am aware, only two such claims were preferred against the United States Government, one by the Cuba Submarine Telegraph Company and one by the French Cable Company. That of the Cuba Submarine Telegraph Company was presented in November, 1899, but no compens

The Boris Effect pt II - with another graph.


While I wait for the ward level data, here's a bit more on the Mayoral first preference votes.  This graph shows the advance or decrease in the votes for Boris or Livingstone from 2008:


I have not been able to come up with a prettier looking positive / negative chart, but I think this tells the tale fairly clearly.

First up, note the huge upswing for Livingstone in the London borough of - wait for it, wait for it - Tower Hamlets (and, technically) City and Newham.  Quelle surprise.  While TH's equivalence to Richard Daley's Chicago for non-traditional democracy is well known, one can also factor in the absence of a Trot mayoral candidate this time.   Bar North East, Livingstone did not put as much as 5000 votes anywhere else.  What, one wonders did he do to so alienate Merton & Wandsworth?  Threaten to cancel Wimbledon and turn Clapham Common into a radioactive tip?  He dropped just shy of 10,000 votes from 2008.

Boris gained a small uplift in Barnet & Camden, where Livingstone fell back.  I think that certain hateful comments about Jewish Londoners did KL no favours.  Boris got his biggest upswing in my own haunt of South West.  Set against that, note the heavy falls in the Boris vote in Bexley & Bromley and Havering & Redbridge.  I'm putting this down to the bone-idleness of Tories in the eastern outer 'burbs rather than anything else.    

Saturday 5 May 2012

The Boris Effect - with gratuitous graphs

Until such time as the London Elects bods get around to providing ward level data and I can go to town on that, I have been fiddling around with 2008 and 2012 data to see how Boris (hurrah for his re-election, btw) fared on first choice votes relative to his ideological confrères in blue.

Chart one shows the percentage of Boris's vote achieved by each Conservative assembly candidate in 2008 and 2012 and in each case the candidate fared worse than Boris in 2012 than in 2008, or if you prefer, Boris outdid the candidate each time.  So, taking a wholly random example, South West's Tony Arbour polled 76,913 votes to Boris's 90,061 in 2008 - or 85.4% of Boris's total.  In 2012 the figures were 69,151 to 92,180 and 75%.  This gives a Boris Factor or BF of 10.4.

The lowest BF is in Bexley & Bromley, at 1.8.  B&B is a pretty solid seat, so that comes as no great surprise, and it could be argued that folk were more inclined to vote for the slate than elsewhere.  Lambeth & Southwark had a BF of 4.9, suggesting that those poor, benighted souls were sticking with the local Streatham lad made bad.

At the other end of scale, Barnet & Camden had an epic BF of 24.5, and Brent & Harrow's was 21.6.

More later, maybe.                  

Monday 23 April 2012

The Front National's vote share - it's a bit more complicated....

Judging from news websites and the Today programme, the second lead story on the French presidential election is that Marine Le Pen's Front National scored its 'highest ever share of the vote', at 17.9%.  And in strict terms that it is true, if somewhat misleading.

A little digging in the 2002 results shows that there was a split in the FN vote between the old poujadiste's original FN, and the Mouvement National Républicain, which split from the FN in 1999.  Le Pen polled 16.86% in 2002, while the MRN polled a further 2.34%, for a combined 19.2%.  While the MRN is / was a tad more respectable (so to speak) than the FN, there cannot be any serious argument but that the two parties were fishing in the same pool.

More fun with French stats later, probably.

Wednesday 18 April 2012

Your cut out 'n' keep to London's least talented electorates

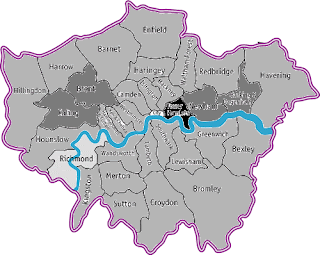
Those nice people at London Elects have been kind enough to make ward level data from the 2008 Mayoral / LA elections available, and turnout and vote share maps having been done elsewhere I've had a go at doing spoilt ballots, council by council.

  
Black (hello and welcome, Tower Hamlets) represents 3.2% of all first choice ballots being ineligible through mismarking, no mark etc.  Dark grey (Ealing, Brent, Newham and Barking and Dagenham) represents 2.1-3.1% ineligibility and light grey 1.1-2.0%.  Very light grey - Richmond - managed a 99% success rate and the City of London 99.6%.

Ward level data shows that the very worst figure is a 7.08% vote failure in Alperton, a ward in Brent.  if Wikipedia is to be believed, Alperton is 75% ethnic Indian and 10% ethnic Sinhalese/Tamil, so it would seem that language might be a problem.  Also at or around 1 in 20 are are Southall Green (Ealing, 5.9%), Spitalfields & Banglatown (Tower Hamlets, 5.5%), St Dunstan`s & Stepney Green (Tower Hamlets, 5.1%) Whitechapel (Tower Hamlets, 4.9%), Norwood Green (Ealing, 4.9%), Larkhall (Lambeth, 4.9%) and Kenton East (Harrow, 4.8%).

At the other end of the scale, two out of 1,312 City of London postal voters made a hash of it (0.15%), while the most talented polling station visitors were to be found in Kensington & Chelsea's Royal Hospital ward where 99.43% got it right.  Nice that the Chelsea Pensioners are keeping good company, and doubtless providing it themselves.        

Digging a little bit deeper, Alperton leads for blank ballots - 4.4% and while all of the electors of Bromley -Biggin Hill found something to mark.  Identifying oneself on the ballot paper seems to be a Lambeth vice, at 2.8% in Larkhall and 1.4% in Oval.  Over voting was big in Plaistow South (Newham) - 3.3%, Southall Green (Ealing) - 3.2% and Tottenham Hale (Haringey) - 3.1%

Friday 30 March 2012

Pass the brain bleach


We live in dark and terrible times - that man Galloway is back in Parliament, hot sausage rolls are VATable, newsreaders wear horrid ties and so on. And now this:


Clearly spelling is no higher than, at best, his fourth priority.